Use Tables and Graphs from Health ReportsDan Jackson2022-06-29T15:51:58+10:00
Epidemiology is often converted into tables and graphs that are used to provide pictures of trends in disease, illness and disability.
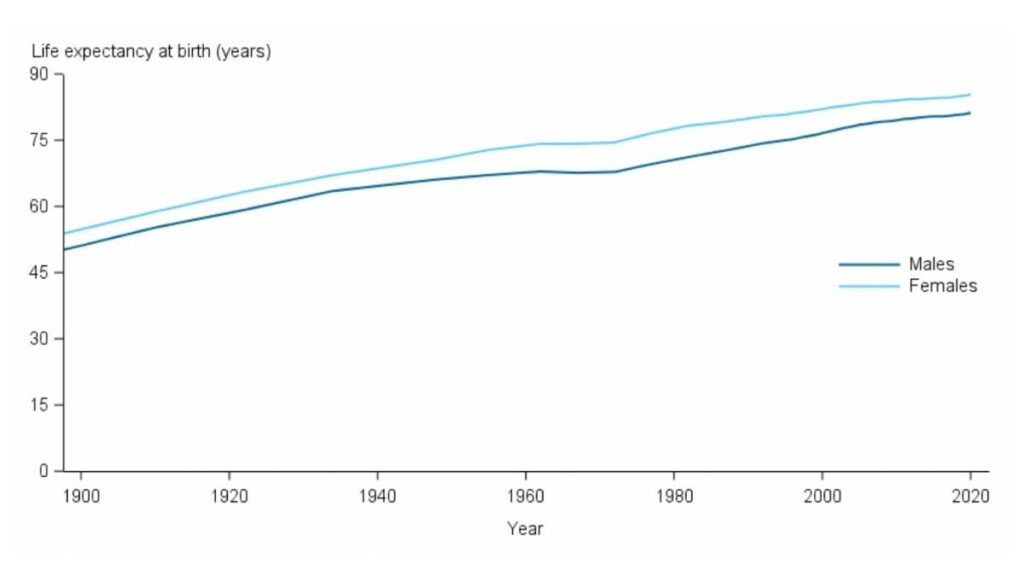
Currently, in 2022, Australia’s life expectancy is 82.9. With males expecting to live 81.2 years and females 85.3 years. This puts us in 7th place against other OECD countries.
Life expectancy at birth (AIHW 2020)
Mortality
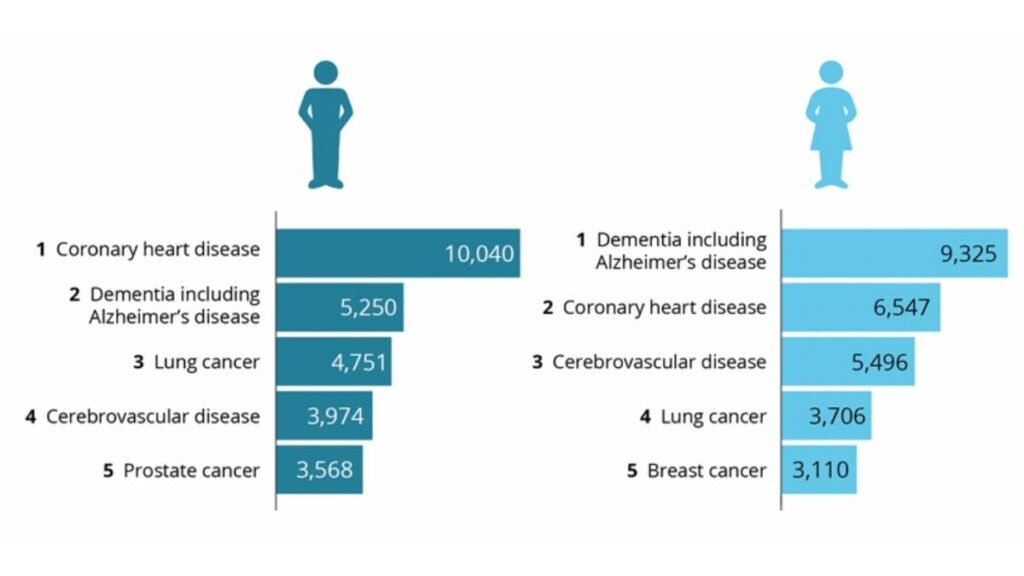
The leading causes of mortality in Australia are currently
Coronary heart disease
dementia and alzhiemers
Cerebrovascular disease
Lung cancer
Prostate cancer (males), and
Breast cancer (females)
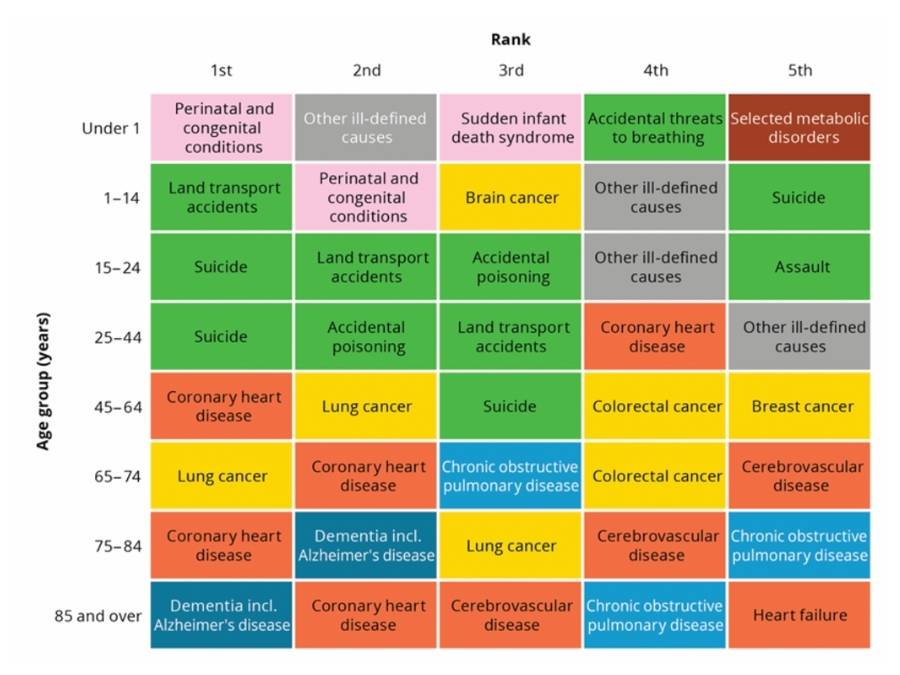
Leading causes of mortality by age (AIHW 2022)
Leading causes of death by sex (AIHW 2022)
Declining Mortality
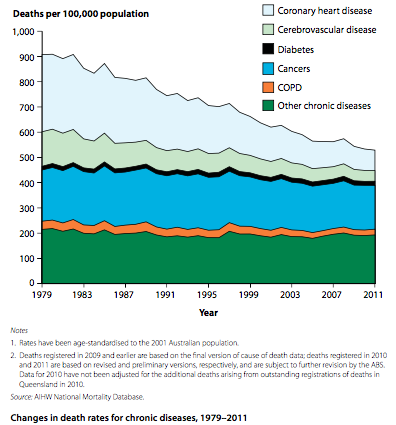
Various death rates are on the decline as Australians become more educated and health promotions have an impact. This includes those caused by: cardiovascular disease, car accidents, COPD, and cancers. The graph on the right depicts the changes in death rates from some of the leading causes of death in Australia. This graph is a little old, but everything here other than diabetes is on the decline.
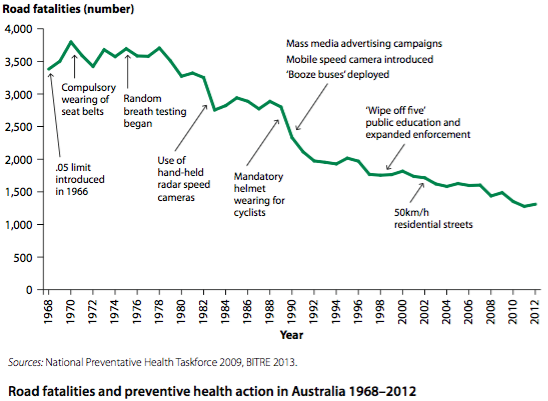
Road Fatalities
The death rate from road accidents in the 15-24 age bracket has also fallen. Various changes to our roads may have helped this, including the 3-year P-plate system and tougher laws on speeding. However, it should be noted that in this age bracket, males make up ¾ of road deaths. You can also see on the graph to the left that many of the big reductions in road deaths occurred when seat belts were made mandatory in cars and as helmets and speed cameras were introduced.
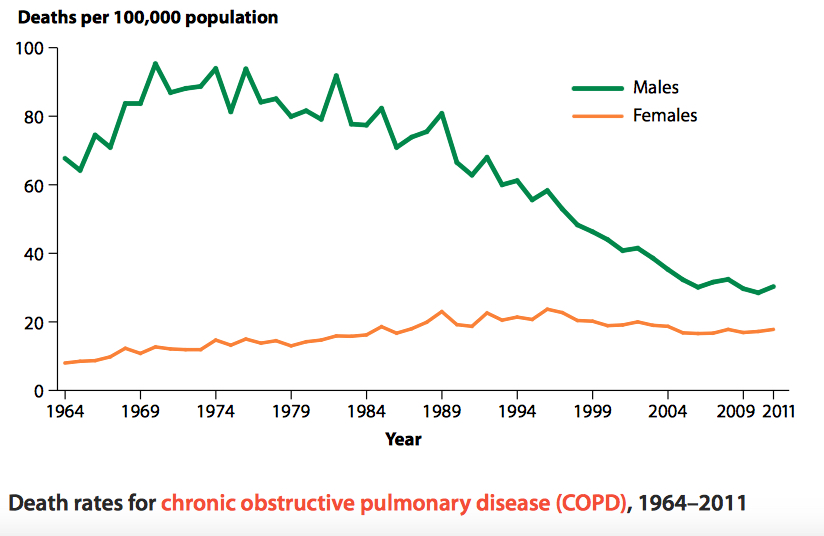
COPD
Deaths from Chronic Obstructive Pulmonary Disease (COPD) are also falling. This can be linked with the same trend found in cardiovascular disease, as one of the major causes of COPD is smoking.
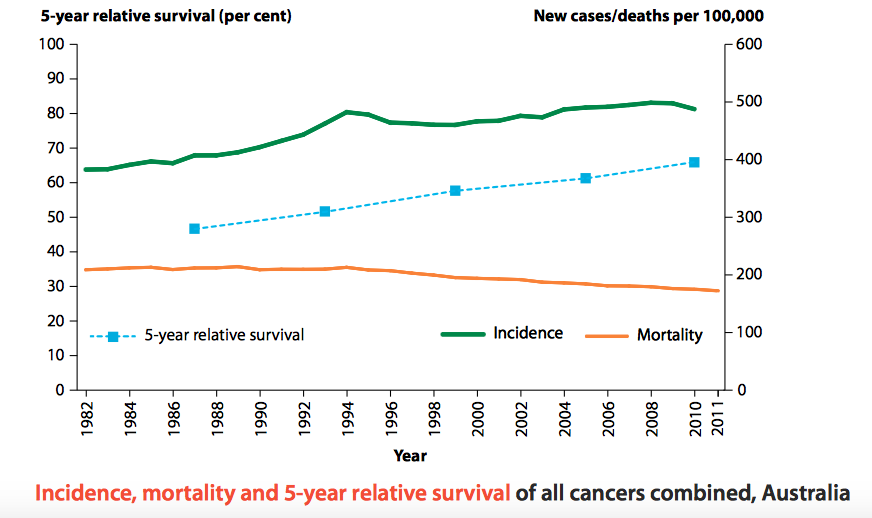
Cancer
Finally, mortality caused by cancers is on the decline. There are more people being diagnosed because early detection methods such as breast screening and prostate examinations have become more available and used more frequently. This leads to an increase in diagnosis, but also an increase in survival rates and a decrease in mortality, as seen in the graph on the left.
Morbidity
The major causes of morbidity in Australia include: those that cause death along with musculoskeletal, mental health and sexual health issues. Below is a table of the most common chronic diseases in Australia by age and sex. The 10 major chronic conditions focused on by AIHW are arthritis, asthma, back pain, cancer, cardiovascular disease, chronic obstructive pulmonary disease, diabetes, chronic kidney disease, mental health conditions, and osteoporosis.
This table shows the differences between males and females in terms of the major causes of morbidity. Males and females also differ in their levels of disability caused by these and the number of Years Lived with a Disability (YLD).
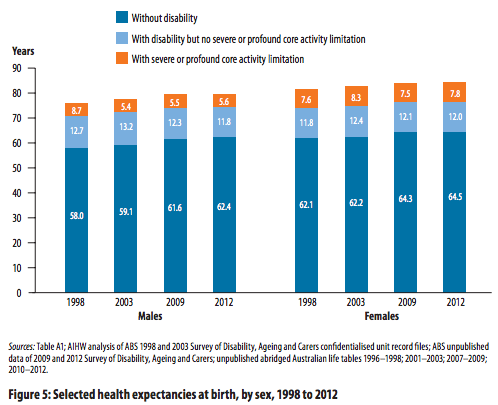
The graph on the right shows the differences between males and females across the years. You can see the upwards trend in life expectancy for both, and the increase in life without disability. For males the life with disability is decreasing, while for females it remains fairly constant (most likely due to their greater life expectancy). This is also summarised in the image below.
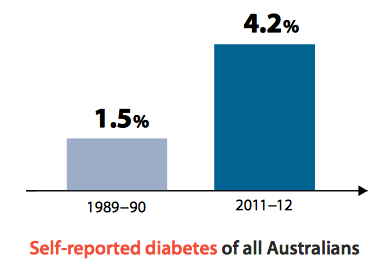
Diabetes
One of the big concerns in Australia currently is the increase in diabetes. Diabetes is an expensive disease as it requires frequent medication and type II is easily avoidable through regular exercise and a balanced diet.
Australia's Health 2014
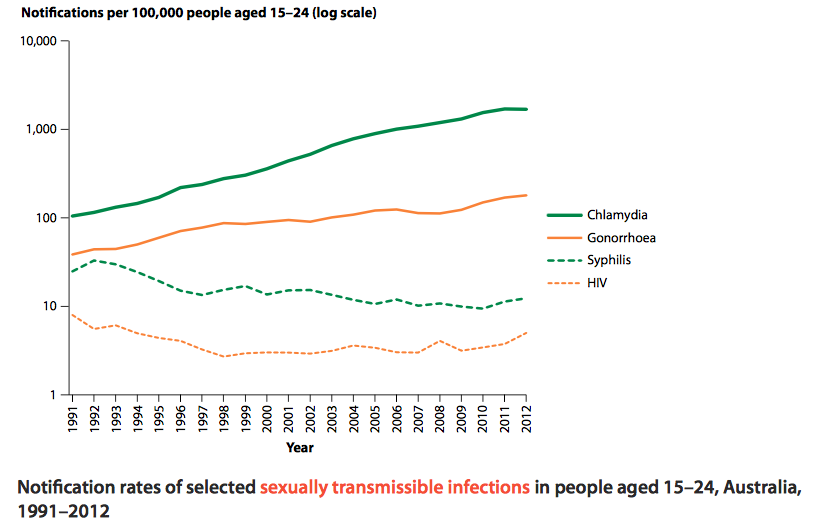
Sexually Transmitted Infections
STI’s are also increasing at the moment. The graph below depicts the increases in the four more commonly known diseases.
These rising rates are for both males and females.
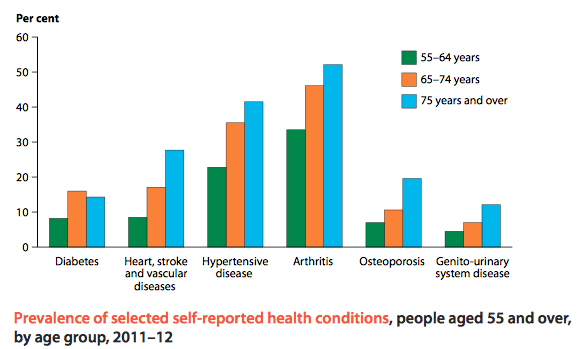
Musculoskeletal
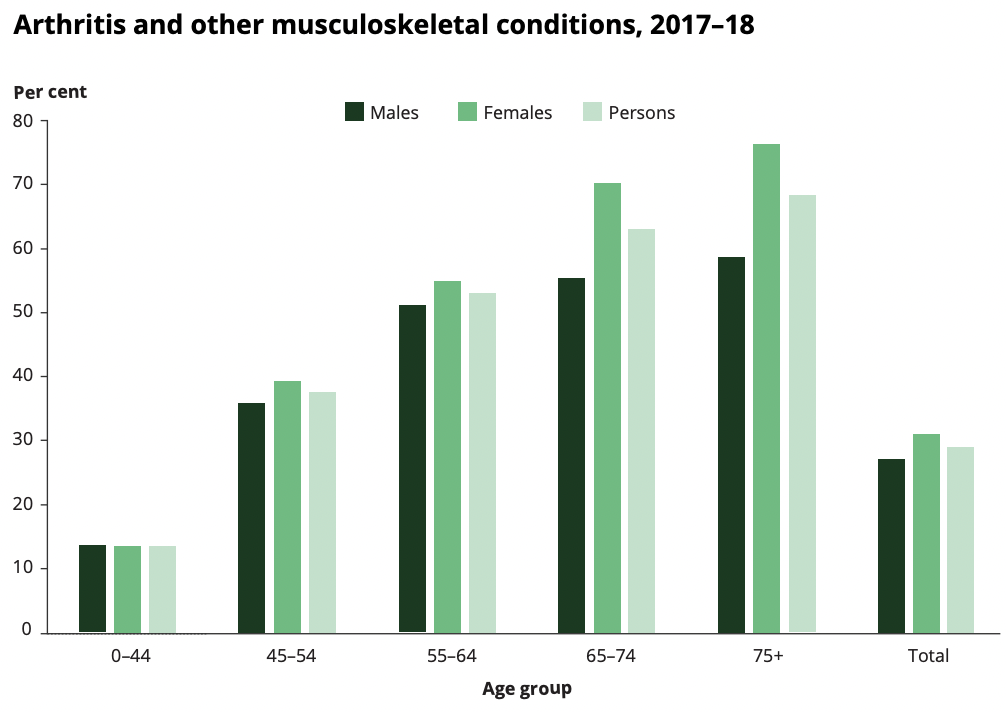
Within the musculoskeletal area of disability and injury, Hip and knee replacements are on the rise. This coincides with our aging population, as frequently these replacements are occurring in older people. This increase in aging is also causing a higher prevalence and incidence of arthritis, hypertension, and osteoporosis.
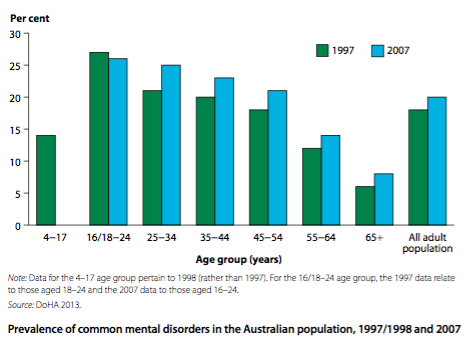
Mental Health
Our mental health is also getting worse, with a higher prevalence of mental disorders across all age groups but the young.
Australia's Health 2014
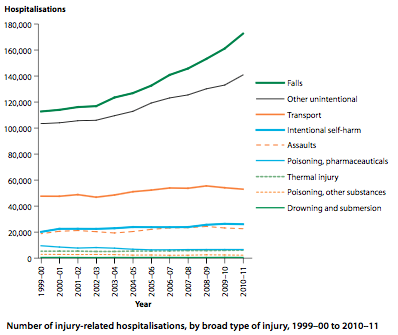
Injury
Hospitalisations for injury are increasing for those caused by self-harm, which connects to our rising mental health issue.
Australia's Health 2014
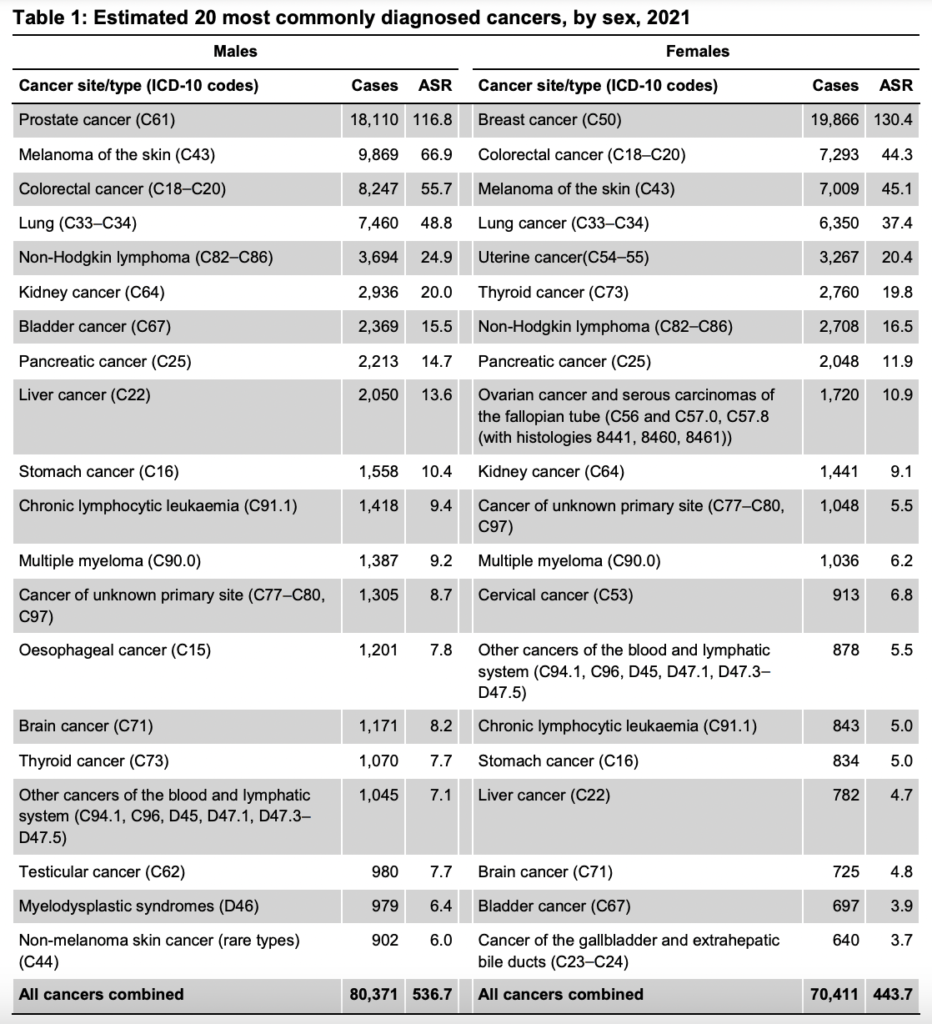
Cancer
Although the death rates from cancer are decreasing, the incidence of cancer diagnosis is rising for both males and females. The main cancers are prostate, breast, melanoma, and colorectal cancers.
Cancer in Australia 2021
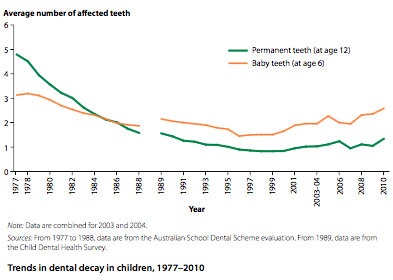
Dental
Tooth decay was decreasing, but has recently risen again. Tooth decay is caused by poor diet, poor dental hygiene routines, and the fact that 30% of Australians are scared to go to their dentist.
Australia's Health 2014
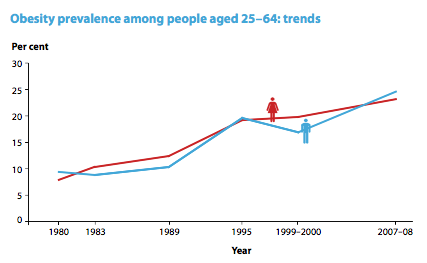
Obesity
There is a current rise in obesity occurring across Australia. Obesity is linked with numerous lifestyle diseases, such as cardiovascular disease, many cancers, hypertension, and diabetes.
Australia's Health in Brief 2012
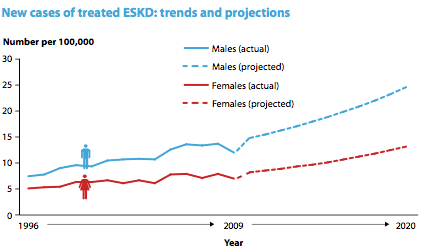
Kidney Disease
Australia is also experiencing a rise in kidney disease, which results from alcohol consumption, poor diet, medications, as well as other factors.